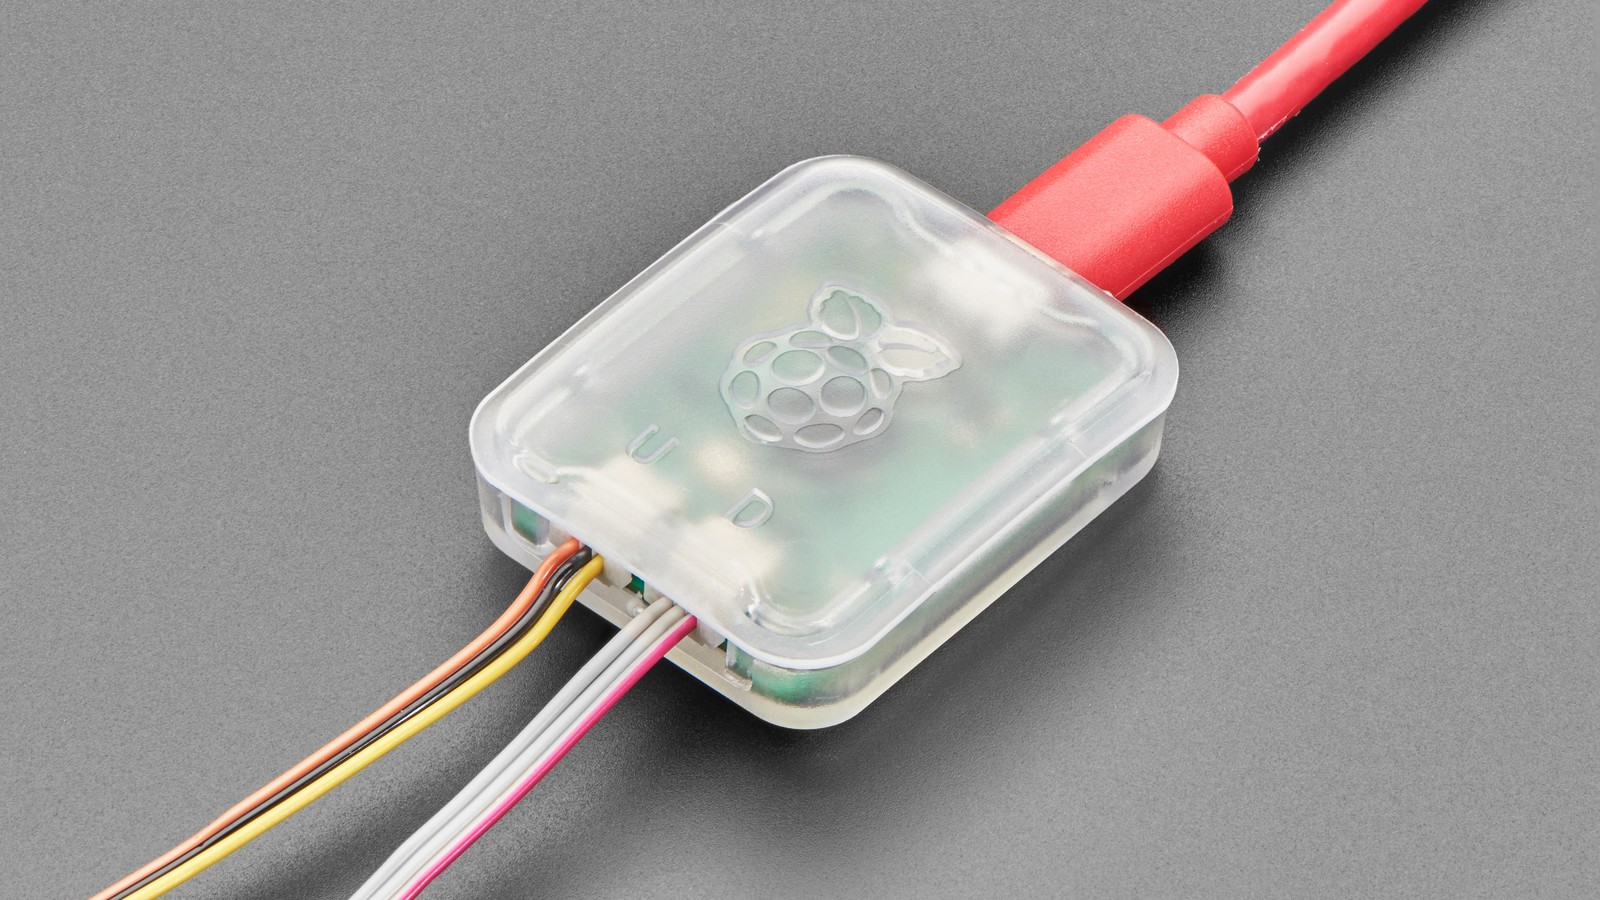
The Raspberry Pi Debug Probe has two separate jobs behind one USB connection. Its UART port carries serial console traffic; its SWD port lets OpenOCD and GDB halt an Arm microcontroller, inspect registers, set breakpoints and step code. Choosing the wrong connector is the fastest way to get a working serial log but no debugger—or a debugger that never sees the target.
Featured image: Adafruit.
Use UART when the firmware can still talk
UART is the lower-friction path for boot messages, assertions and application logs. Connect probe TX to target RX, probe RX to target TX, and ground to ground. Then open the enumerated serial device at the baud rate configured by the firmware.
A UART transcript can prove that code reached a checkpoint or expose a crash message. It cannot pause the CPU at a source line, read core registers on demand or recover state after the firmware stops servicing the serial peripheral. For those operations, move to SWD.
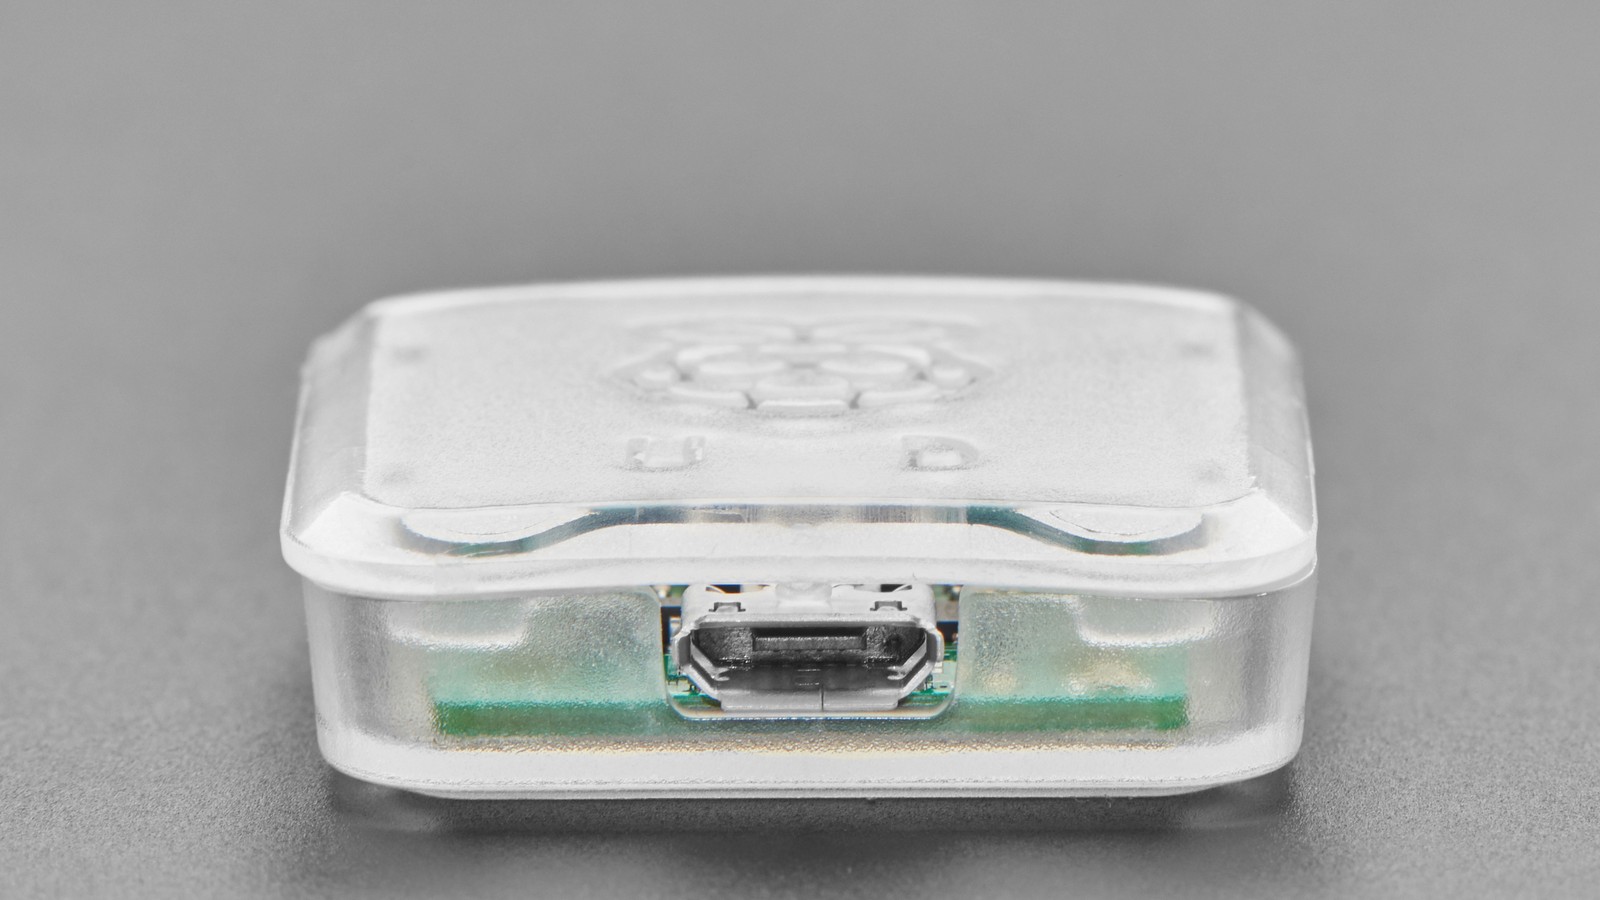
Use SWD when you need control of the target
The three-pin SWD connection carries SWCLK, SWDIO and ground. The target must be powered from its intended supply; the probe is a debug interface, not a reason to create a second uncontrolled power path. Confirm the connector orientation and common ground before changing software.
For an RP2040 target, a minimal OpenOCD launch commonly selects the CMSIS-DAP interface and RP2040 target configuration:
openocd -f interface/cmsis-dap.cfg -f target/rp2040.cfgOpen a second terminal with the ELF file that contains debug symbols, then attach GDB to OpenOCD’s default port:
arm-none-eabi-gdb build/app.elf
(gdb) target remote localhost:3333
(gdb) monitor reset halt
(gdb) load
(gdb) break main
(gdb) continue
The exact GDB executable and target configuration depend on the MCU and toolchain. The diagnostic boundary does not: OpenOCD must first enumerate the CMSIS-DAP probe and identify the target before GDB can control useful state.
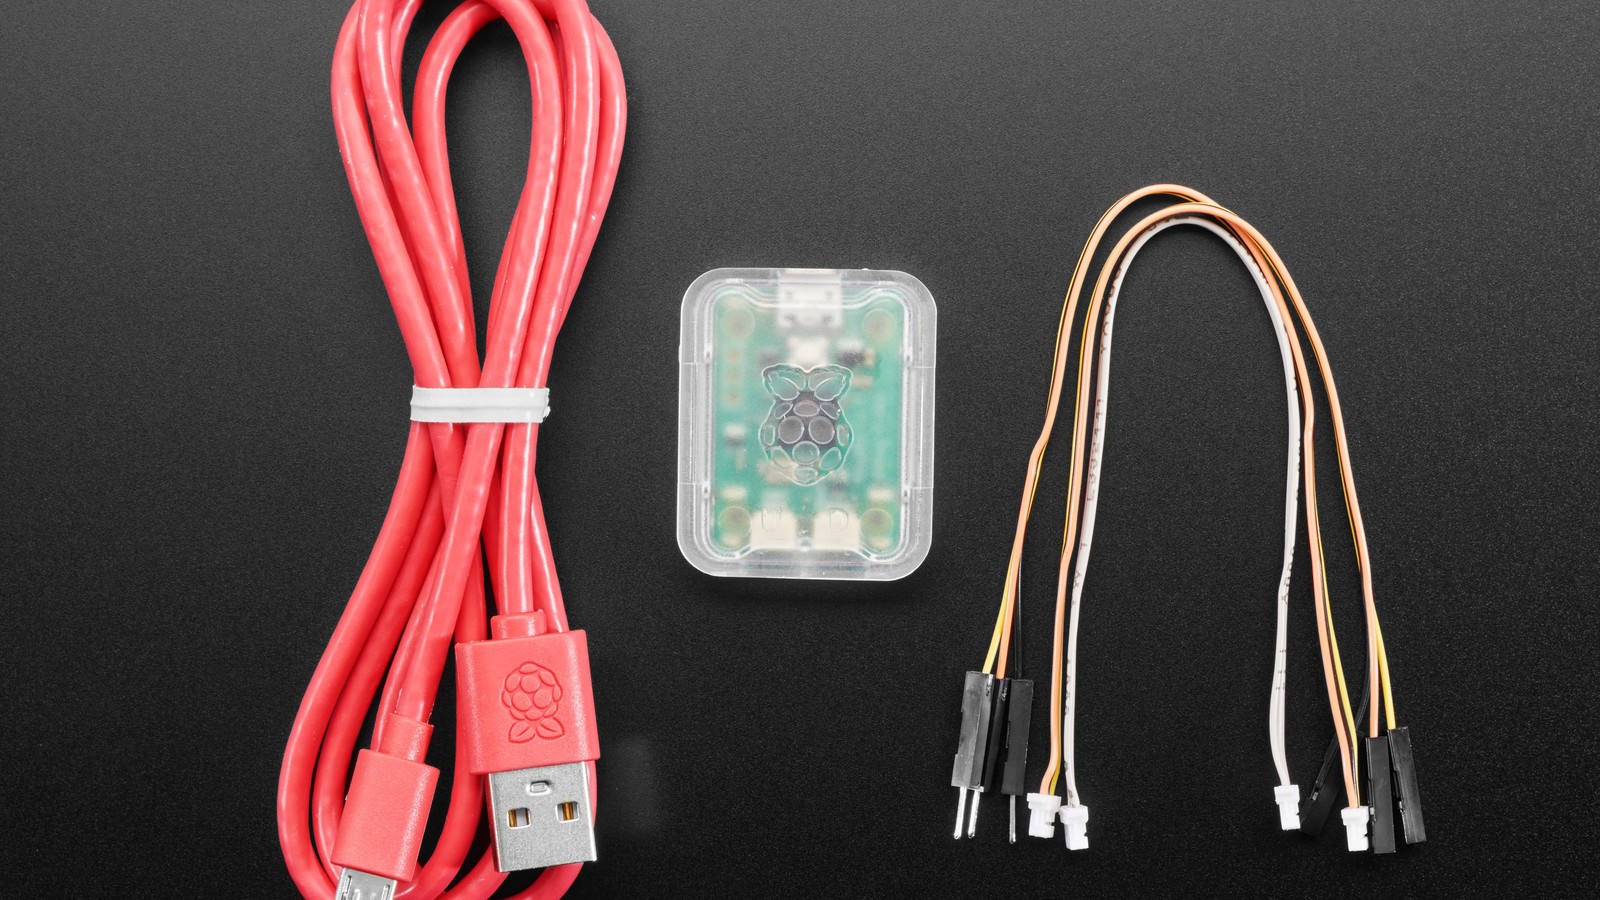
Localize the failure before editing code
If no USB device appears, inspect the host cable, port, permissions and probe firmware. If OpenOCD sees CMSIS-DAP but cannot identify the target, check SWDIO/SWCLK orientation, ground, target power and the selected target configuration. If OpenOCD halts the target but GDB shows no source lines, verify that the loaded ELF matches the flashed build and still contains debug information.
UART and SWD also complement other instruments. A logic analyzer can verify peripheral timing while SWD reveals firmware state, and the boot-sequence discipline used in the ESP32 boot-mode guide applies here too: prove each boundary before replacing hardware.
The probe is based on RP2040 hardware and follows the CMSIS-DAP standard. That makes it useful beyond a Pico, but only when the target exposes a compatible Arm SWD port and electrical levels. Check the target documentation rather than assuming every three-pin header has the Raspberry Pi debug pinout.