Scope: This is a conceptual, signal-level STEM lesson. TVG Report did not instrument or road-test the e-bike sensor systems discussed here.
Cadence and torque signals answer different control questions. A cadence sensor reports crank rotation; a torque sensor measures a load-related quantity that the system uses to estimate rider effort. Production e-bikes may combine both with speed and other inputs, so this is not a universal either-or architecture.
Start with the signal path
A useful classroom model is:
Rider input → sensor → controller logic → commanded assist.
A pulse-based cadence example introduces event detection and state logic. Firmware can use pulse timing to determine whether the crank is moving and, depending on the implementation, estimate rotational rate. A torque signal adds scaling, calibration, filtering and plausibility checks because the measured value varies with load.
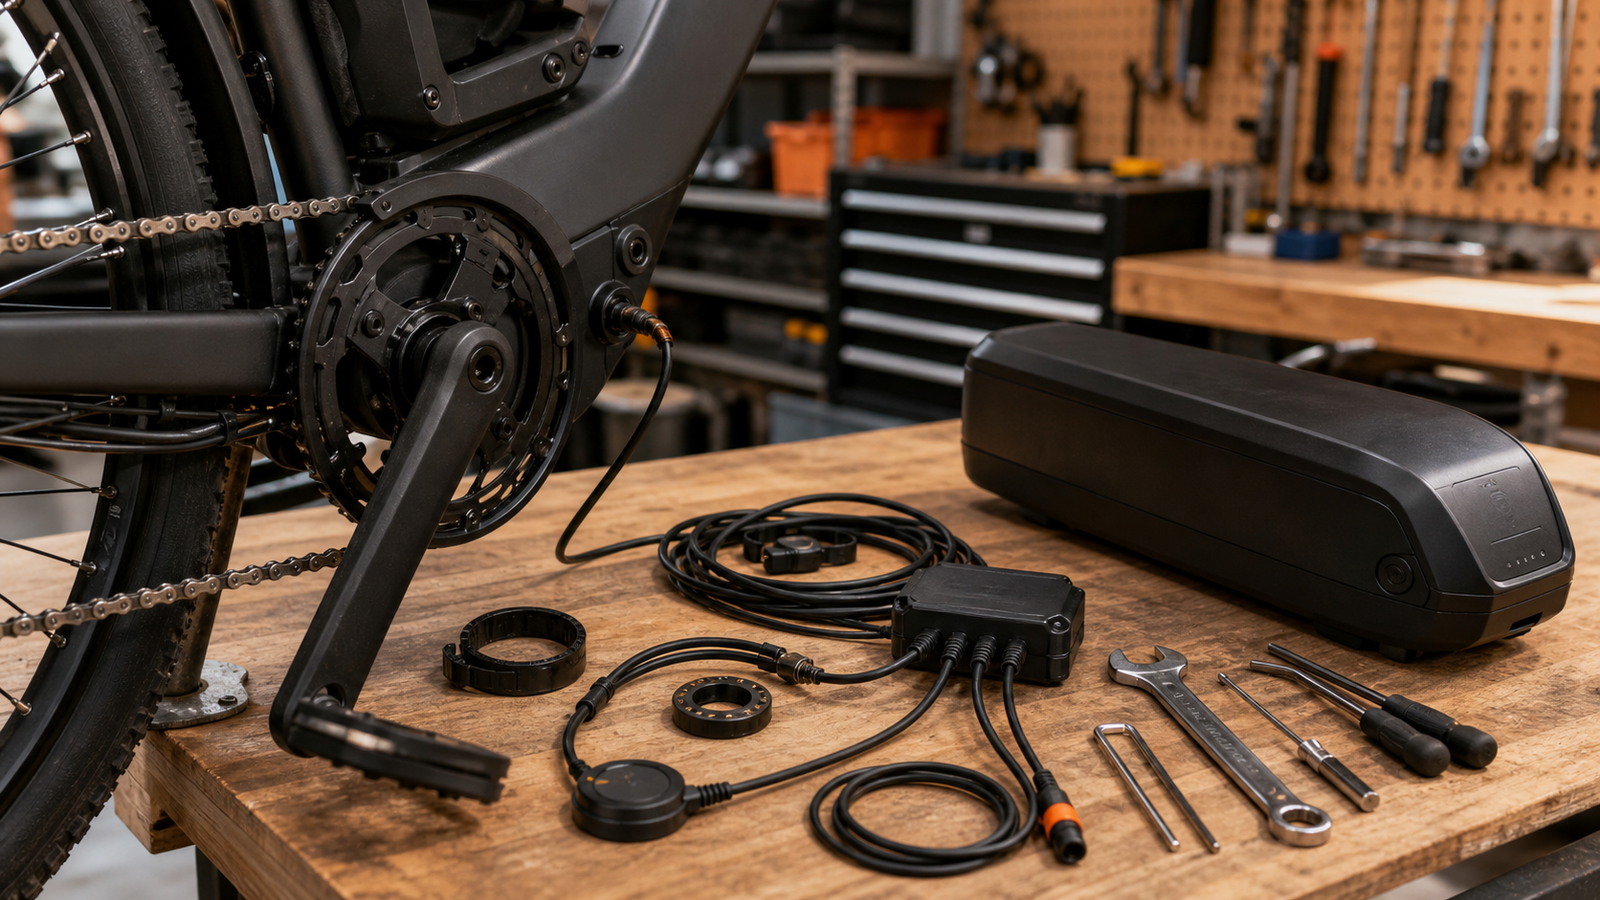
Two signals, two questions
- Cadence: Is the crank rotating, and how quickly are events arriving?
- Torque: What load-related magnitude is the sensor reporting?
Torque-derived input can support effort-proportional control, but perceived smoothness also depends on sampling, filtering, controller tuning, motor response and other sensor inputs. Likewise, a cadence-based controller does not have to behave like a simple on/off switch; its response depends on the firmware around the signal.
A classroom-safe observation exercise
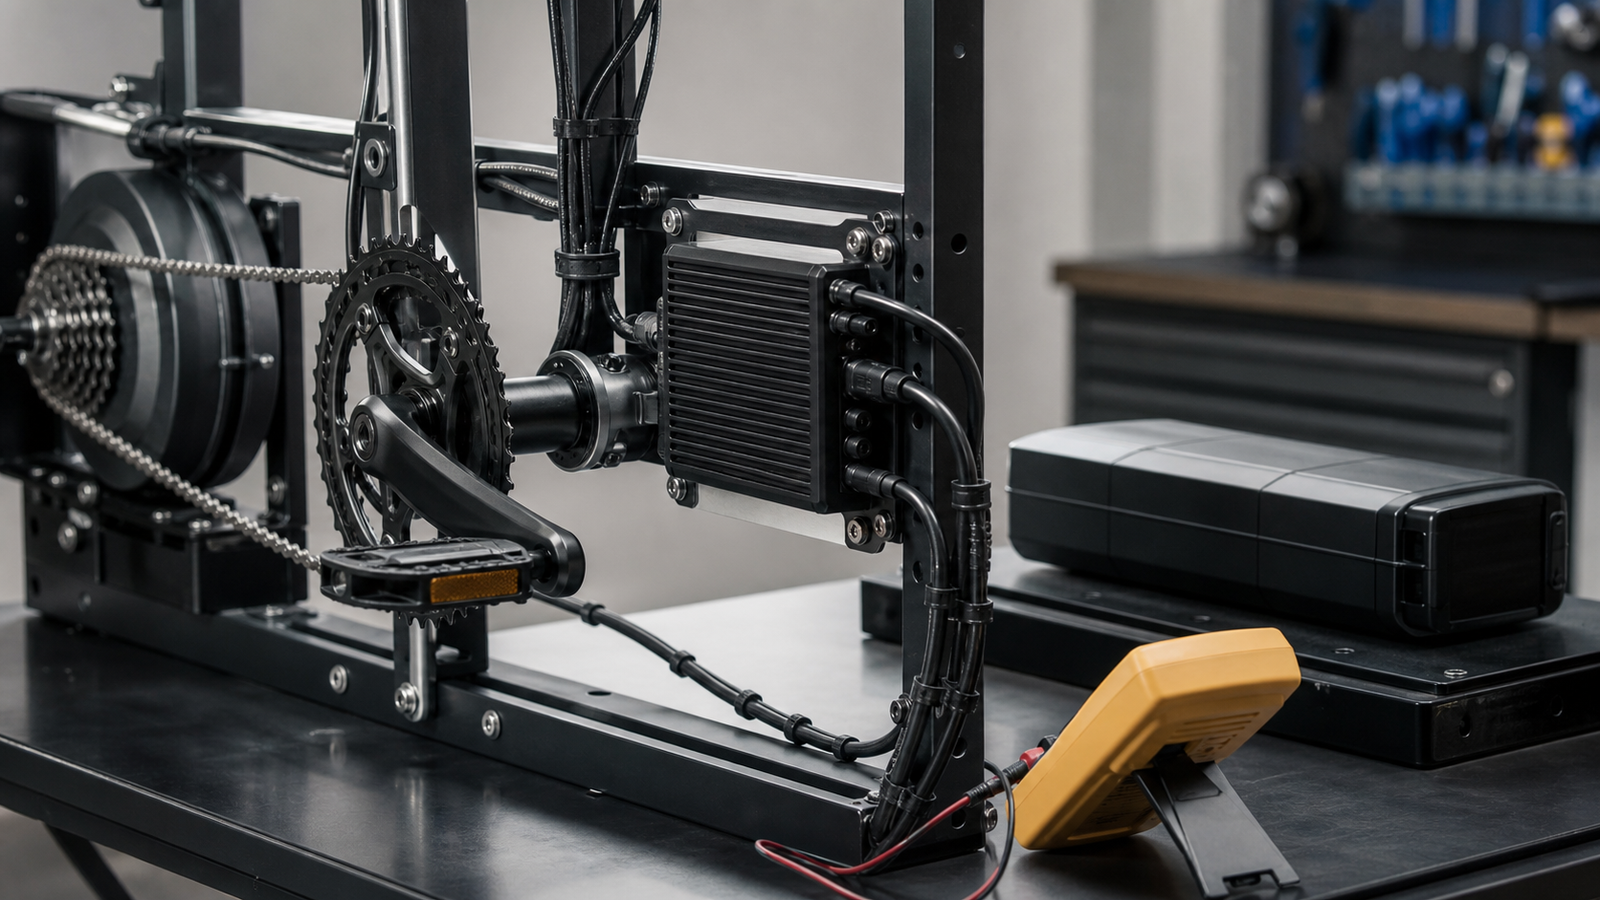
Keep the exercise at signal level. Use prerecorded traces, a manufacturer training unit or low-voltage sensor/simulator hardware. Do not alter road-bike firmware, defeat safety cutoffs, open a traction battery, energize an unsupported drive system or run an exposed wheel or drivetrain in a classroom.
Students can compare:
- how quickly a start or stop appears in the data;
- whether noise creates false transitions;
- how filtering changes delay;
- how scaling or calibration changes a torque-derived value;
- how software should respond to missing or implausible inputs.
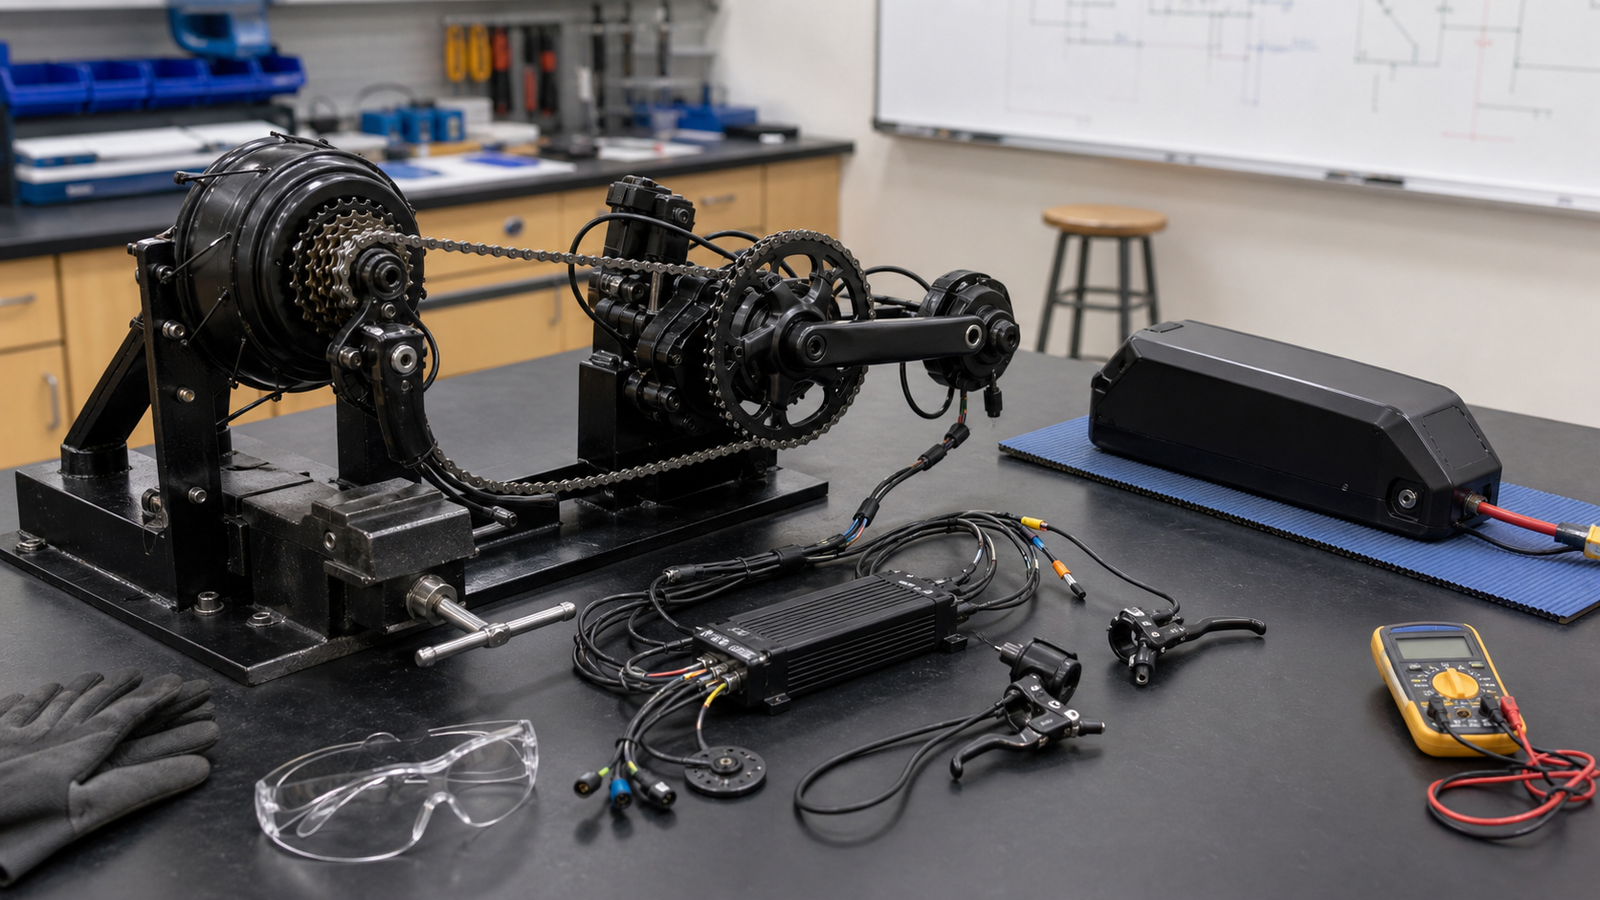
What the traces cannot prove
A signal-level exercise can illustrate event detection, proportional input, delay and filtering. It cannot establish the ride quality, safety or performance of every cadence- or torque-based e-bike. Bosch, for example, documents systems that use torque, cadence and speed inputs together; its implementation should not be generalized to every controller.
Discussion prompts
- What should the controller do when cadence pulses stop unexpectedly?
- How much filtering delay is acceptable before the system feels unresponsive?
- Which values should trigger a fault instead of an assist command?
For real-bike fault isolation rather than the classroom lesson, see TVG’s maker-garage sensor diagnostics guide.